
As security researchers, we often find ourselves needing to look deep into various kernels to fully understand our target and accomplish our goals. Doing so on the Windows platform is no mystery, as there have been countless well-written posts about kernel debugging setups. For macOS, however, the situation is slightly different.
There are many great posts describing how to set up kernel debugging between two machines, but all of them suggest that SIP (System Integrity Protection) should be disabled for kernel debugging. This creates a problem if we want to investigate the inner workings of macOS’s security mechanisms, since turning off SIP will also turn off most of the foundational security features of the operating system.
This blog post will describe a couple of setups that allow you to have SIP enabled while debugging.
Our setup is as follows:
- HOST: macOS Catalina 10.15.4 with supplemental update
- GUEST: macOS Catalina 10.15.4 with supplemental update
- VMware Fusion 11.5.3
- Debugger: LLDB
Advance your macOS security skills
The Good
We will start by debugging the original release version of the kernel, which is included by default on macOS. This is by far the easiest method we will see.
Our first step is to download the Kernel Debug Kit (KDK) from Apple’s Developer Downloads. Before we do that however, we need to determine the build version we are interested in. This can be accomplished with the following command on the guest VM:
ProductName: Mac OS X
ProductVersion: 10.15.4
BuildVersion: 19E287
Listing 1 – Retrieving the kernel build version info
Once we know the BuildVersion number, we can download the corresponding KDK and install it on our host. It will be installed under /Library/Developer/KDKs/.
total 212112
-rwxr-xr-x 1 root wheel 16030560 Mar 5 07:38 kernel
drwxr-xr-x 3 root wheel 96 Mar 5 07:38 kernel.dSYM
-rwxr-xr-x 1 root wheel 23795528 Mar 5 07:27 kernel.debug
drwxr-xr-x 3 root wheel 96 Mar 5 07:27 kernel.debug.dSYM
-rwxr-xr-x 1 root wheel 19329072 Mar 5 07:39 kernel.development
drwxr-xr-x 3 root wheel 96 Mar 5 07:39 kernel.development.dSYM
-rwxr-xr-x 1 root wheel 49436536 Mar 5 07:30 kernel.kasan
Listing 2 – KDK location
The next step is to enable remote debugging on our guest VM. Fortunately, VMware Fusion has a feature called gdb stub, which sets up a GDB server and allows a debugger to debug any VM (including Windows) using the GDB remote protocol. Since LLDB supports the GDB protocol, we can use this approach.
To enable the GDB stub for our guest VM, we need to add the following line to our virtual machine vmx configuration file:
Listing 3 – Enabling the VMware gdb stub
Next, we boot up the VM, launch lldb on our host, and issue the following commands to specify our kernel and also enable loading of symbol files:
(lldb) settings set target.load-script-from-symbol-file true
(lldb) gdb-remote 8864
Listing 4 – Starting LLBD with appropriate symbols
The first command will tell lldb where to find the kernel symbols. This command is not strictly necessary, as lldb will search the /Library/Developer/KDKs path and any other which is indexed by Spotlight, but it can be still a good practice in case the search fails.
The second command will tell lldb to load any scripts found inside the symbol (dSYM) directories. This is extremely useful, as these scripts typically extend the functionality of lldb. In the case of the kernel, we get about 400 new commands available to us.
The last command tells lldb which port the remote server is listening on. If we don’t specify the IP address or hostname, like here, it will connect to the localhost. By default, VMware listens on port 8864 on the localhost, so this is where we connect to.
If everything has gone well, we should be breaking into our VM and can start debugging. We can also break again at any point using the “CTRL+C” shortcut from the debugger.
Kernel UUID: AB0AA7EE-3D03-3C21-91AD-5719D79D7AF6
Load Address: 0xffffff8002600000
Kernel slid 0x2400000 in memory.
(...)
Process 1 stopped
* thread #3, name = '0xffffff8009854a40', queue = 'cpu-0', stop reason = signal SIGTRAP
frame #0: 0xffffff800284dede kernel`machine_idle at pmCPU.c:181:3 [opt]
Target 0: (kernel) stopped.
(lldb) image list
[ 0] AB0AA7EE-3D03-3C21-91AD-5719D79D7AF6 0xffffff8002600000 /Library/Developer/KDKs/KDK_10.15.4_19E287.kdk/System/Library/Kernels/kernel
/Library/Developer/KDKs/KDK_10.15.4_19E287.kdk/System/Library/Kernels/kernel.dSYM/Contents/Resources/DWARF/kernel
(...)
Listing 5 – LLDB macOS kernel debugging with symbols
One thing to note is that if our VM and Host are running the same kernel, we could also use the basic kernel binary (/System/Library/Kernels/kernel) as a target. However, we would not have any access to the symbols.
Current executable set to '/System/Library/Kernels/kernel' (x86_64).
(lldb) gdb-remote 8864
Process 1 stopped
* thread #1, stop reason = signal SIGTRAP
frame #0: 0xffffff8003b980f6
-> 0xffffff8003b980f6: rep stosb byte ptr es:[rdi], al
0xffffff8003b980f8: ret
0xffffff8003b980f9: add byte ptr [rax], al
0xffffff8003b980fb: add byte ptr [rax], al
Target 0: (kernel) stopped.
(lldb) image list
[ 0] AB0AA7EE-3D03-3C21-91AD-5719D79D7AF6 0xffffff8000200000 /System/Library/Kernels/kernel
(lldb) memory read 0xffffff8000200000
0xffffff8000200000: cf fa ed fe 07 00 00 01 03 00 00 00 02 00 00 00 ????............
0xffffff8000200010: 12 00 00 00 d0 0f 00 00 01 00 20 00 00 00 00 00 ....?..... .....
(lldb) continue
Listing 6 – LLDB macOS kernel debuging without symbols
Finally, it is important to note that VMware uses hardware breakpoints by default, which limits us to four total. However, this limitation can be overcome by setting the hideBreakpoints setting in the vmx configuration file to FALSE, as shown below:
Listing 6 – Disabling VMWare use of hardware breakpoints
The Bad
In the previous section, we discussed how to set up macOS kernel debugging with the release version of the kernel. Nevertheless, it is important to mention that Apple also releases debug or development kernels as well. According to Apple, they are compiled with “additional assertions and error checking” and these are the ones that can stop and wait for a debugger to connect after initial startup.
For this setup, these kernels are not strictly needed as we will still use the previous feature of VMware. More specifically, the macOS kernel will not be responsible for the actual debugging. However, in case we do need these kernels for a special use case, this is how we can set this up.
Before we do anything else on our guest VM, we first need to temporarily disable SIP. The reason for this because the /System/ path is write-protected by SIP. We can do that by booting into recovery mode (CMD+R after turning on the VM), running the csrutil disable command, and rebooting.
Since the release of macOS Catalina, the / path is mounted as read-only as an additional protection beyond SIP. Therefore, we will need to make it writable so that we copy the debug kernel to the correct location.
Once rebooted, we mount the root directory as writable:
Listing 7 – Mounting the root directory as writable
And copy the kernel of our choice (debug in this case):
Listing 8 – Copying the debug kernel to the appropriate location
Then we need to invalidate the kernel cache. This is required because macOS doesn’t run the kernel binary directly, but rather as a prelinked kernel, which is built from the kernel and the kernel extensions. Normally, the prelinking happens when we install a new kernel extension or kernel, but not in this case. Here, we simply copy in the development or debug version of the kernel.
sudo kextcache -invalidate /Volumes/Macintosh\ HD
Listing 9 – Invalidating the kernel cache
Finally, we will need to set the NVRAM boot arguments to boot into the debug kernel instead of the regular one, and boot into recovery mode to turn SIP back on using the csrutil enable command.
Listing 10 – Setting the boot kernel
We can now run the same commands on our host as before, this time specifying the debug kernel.
(lldb) settings set target.load-script-from-symbol-file true
(lldb) gdb-remote 8864
Listing 11 – Commands to start debug kernel debugging
At this point, we are able to perform macOS kernel debugging on a debug rather than a release version of the kernel.
* thread #2, name = '0xffffff80158f0e28', queue = 'cpu-0', stop reason = signal SIGTRAP
frame #0: 0xffffff80052ee796 kernel.debug`machine_idle at pmCPU.c:181:3
Target 0: (kernel.debug) stopped.
(lldb) image list
[ 0] 16545FA7-C11F-3D9E-88FA-8DDB13E1A439 0xffffff8005000000 /Library/Developer/KDKs/KDK_10.15.4_19E287.kdk/System/Library/Kernels/kernel.debug
/Library/Developer/KDKs/KDK_10.15.4_19E287.kdk/System/Library/Kernels/kernel.debug.dSYM/Contents/Resources/DWARF/kernel.debug
[ 1] A6D59354-C9A1-3C61-87A7-C04DD74421B1 0xffffff7f8609f000 //System/Library/Extensions/corecrypto.kext/Contents/MacOS/corecrypto
(...)
Listing 12 – Debugging the macOS debug kernel
The Ugly
For completeness, we’ll briefly discuss how to set up kernel debugging using the macOS kernel instead of VMware gdb stub. This is the most commonly covered method elsewhere. We will also show that we can enable SIP despite the common misbelief that it has to be turned off.
The steps are essentially the same as before with a small difference. In this case, the NVRAM variables in the debugger box should be set as shown below:
Listing 13 – Setting the NVRAM variables for kernel debugging
In essence, these settings indicate that the debuggee can perform network-level debugging and break on interrupts. The interrupt is tricky, however, as we need to press CMD + OPTION + CONTROL + SHIFT + ESCAPE to break into the debugger. Furthermore, this has to be done on the target VM we are debugging. While others have had success in causing interrupts using this method, we were not as lucky. Instead, we made a keyboard shortcut in VMware Key Mappings using CMD + B for this combination.
“Windows” and “Alt” buttons as the target key mappings, however they translate into “Command” and “Option” respectively in macOS. VMware doesn’t provide an option to specify the macOS version of the keys.
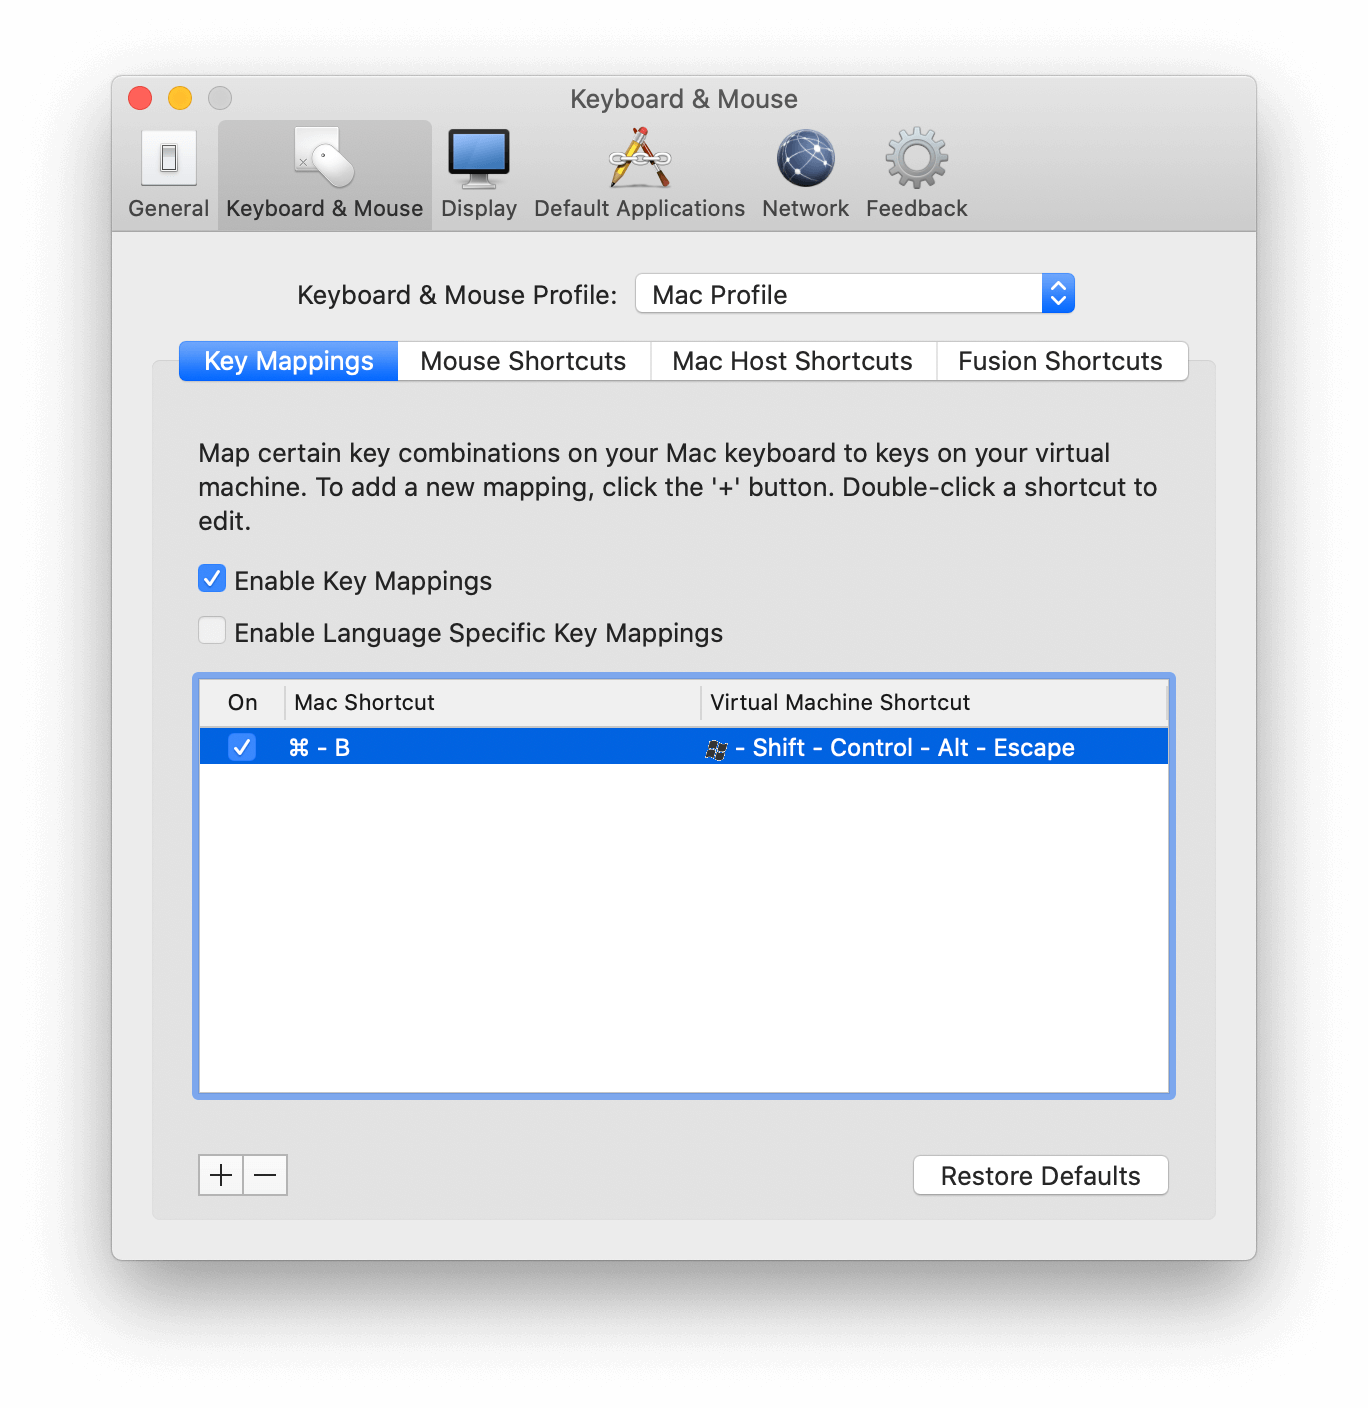
Figure 1: VMware Key Mappings configuration
Finally, on the host machine we will use the kdp-remote command with our debugee IP address, instead of gdb-remote. Please note that before we issue this command, we will need to break into debugger on the debuggee.
Listing 14 – Using kdp-remote
Conclusion
In this post, we demonstrated three different ways of debugging the macOS kernel while determining that permanent disabling of SIP is not necessary. Due to the ease of setup, our preferred method is the first one we described, but others are available if the circumstances require them.
Additional resources:
- Kernel debugging with LLDB and VMware Fusion
- Using the VMware Fusion GDB stub for kernel debugging with LLDB
- macOS Kernel Debugging
- LLDBagility: practical macOS kernel debugging
- Debugging macOS Kernel For Fun
- Boot argument options in OS X
- Making breakpoints work with VMWare gdb stub
- Presentation: SyScan360 – Stefan Esser – OS X El Capitan sinking the S\H/IP
About the Author
Csaba Fitzl has worked for 6 years as a network engineer and 8 years as a blue/red teamer in a large enterprise focusing on malware analysis, threat hunting, exploitation, and defense evasion. Currently, he is focusing on macOS research and working at OffSec as a content developer. He gives talks and workshops at various international IT security conferences, including Hacktivity, hack.lu, Troopers, SecurityFest, DEFCON, and Objective By The Sea. @theevilbit